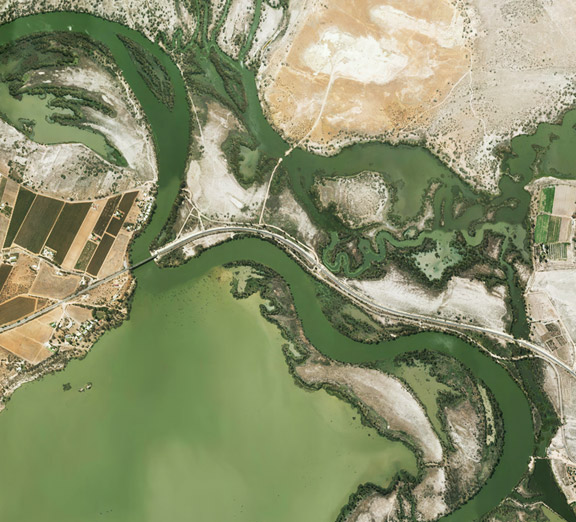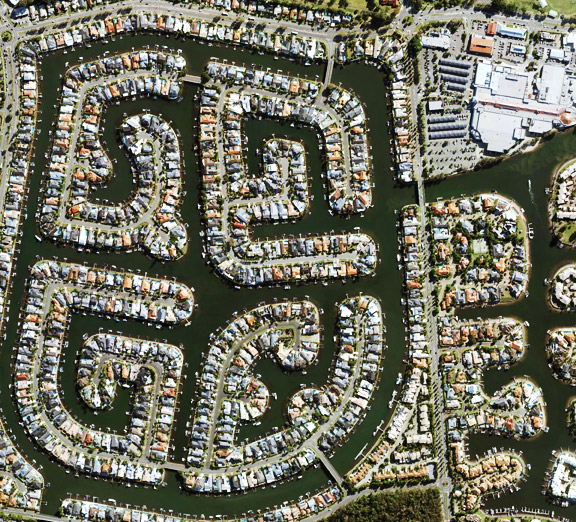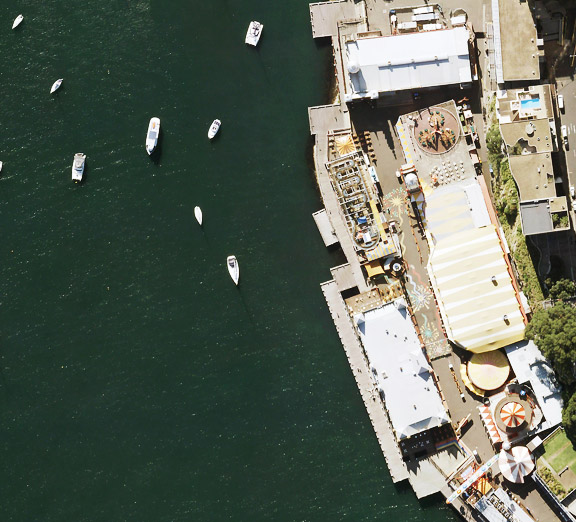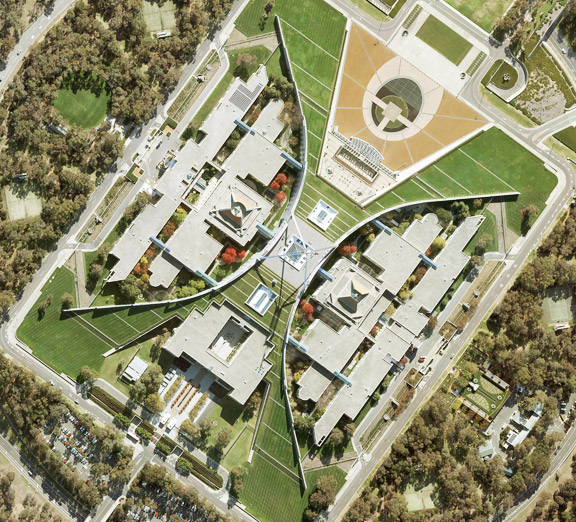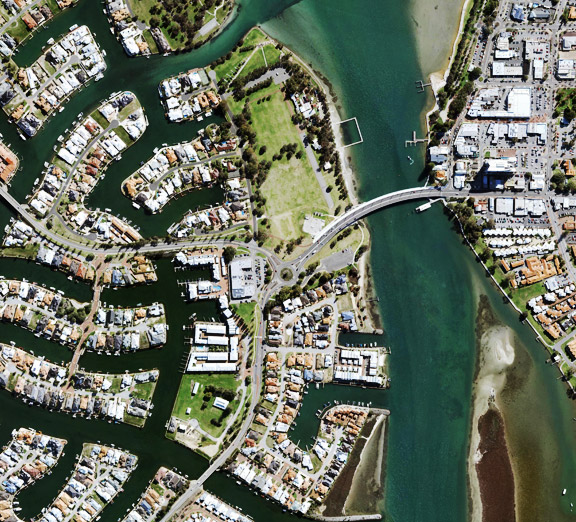
MapViewer is MetroMap’s web-based application, giving users access to high-resolution aerial imagery across Australia from any browser. From within MapViewer, users can search any address or location, measure distances and areas, check elevation and structure heights, draw and annotate plans, and compare current and historical imagery, as well as view oblique and CIR imagery.
MetroMap MapViewer enables users to search, measure, compare, annotate and export aerial imagery through a web browser. Its features include search, the Swipe tool, line, area and circle measurements, saved layers, downloads, elevation profiles, contours, oblique imagery and Street View.
The table below outlines each MapViewer tool, from search and date selection to Street View and location sharing, alongside its respective function:
| Tool | What it does |
|---|---|
| Search | Finds an Australian address, suburb, landmark or coordinate, and keeps the last 5 address searches |
| Date selector | Allows users to select from the latest imagery capture or from a list of previous historical captures in the selected area. Imagery can also be filtered by image type: true colour (RGB), colour infrared (CIR) or oblique |
| Swipe | Puts two capture dates side by side, with a handle that slides between them |
| Line | Measures the distance along a line between two points |
| Polygon and rectangle | Measures area, perimeter and edge lengths; the rectangle tool also lets you enter precise measurements rather than drawing freehand |
| Circle (feature available on Enterprise plans) | Measures area, radius and circumference |
| Marker and label | Pins a point, gives its coordinates and adds a text label |
| Layers | Saves drawings on the map, imports GeoJSON, KML, KMZ and Shapefile files, and exports to KML |
| Watchpoint | Emails the user when a new capture is uploaded for the selected area. |
| Screenshot | Saves the current view and its drawings as a JPG |
| Download and Clip It | Saves imagery with its map position for use in other software |
| Elevation profile (beta) | Graphs ground and surface height along a line |
| Contours and hillshade | Shows slope with lines and shading |
| Colour-Infrared layers | Shows the near-infrared view, making it easy to differentiate healthy and stressed vegetation. |
| Obliques (beta) | Shows buildings at about 45° from the north, south, east and west. Available in select metro areas. |
| Street View and base maps | Adds Google Street View, which can sit beside the imagery in a split screen, plus satellite and road maps from third parties |
| North arrow | Rotates the view when dragged, and resets it to north with one click |
| Location sharing | Sends a spot on the map by email or as a link |
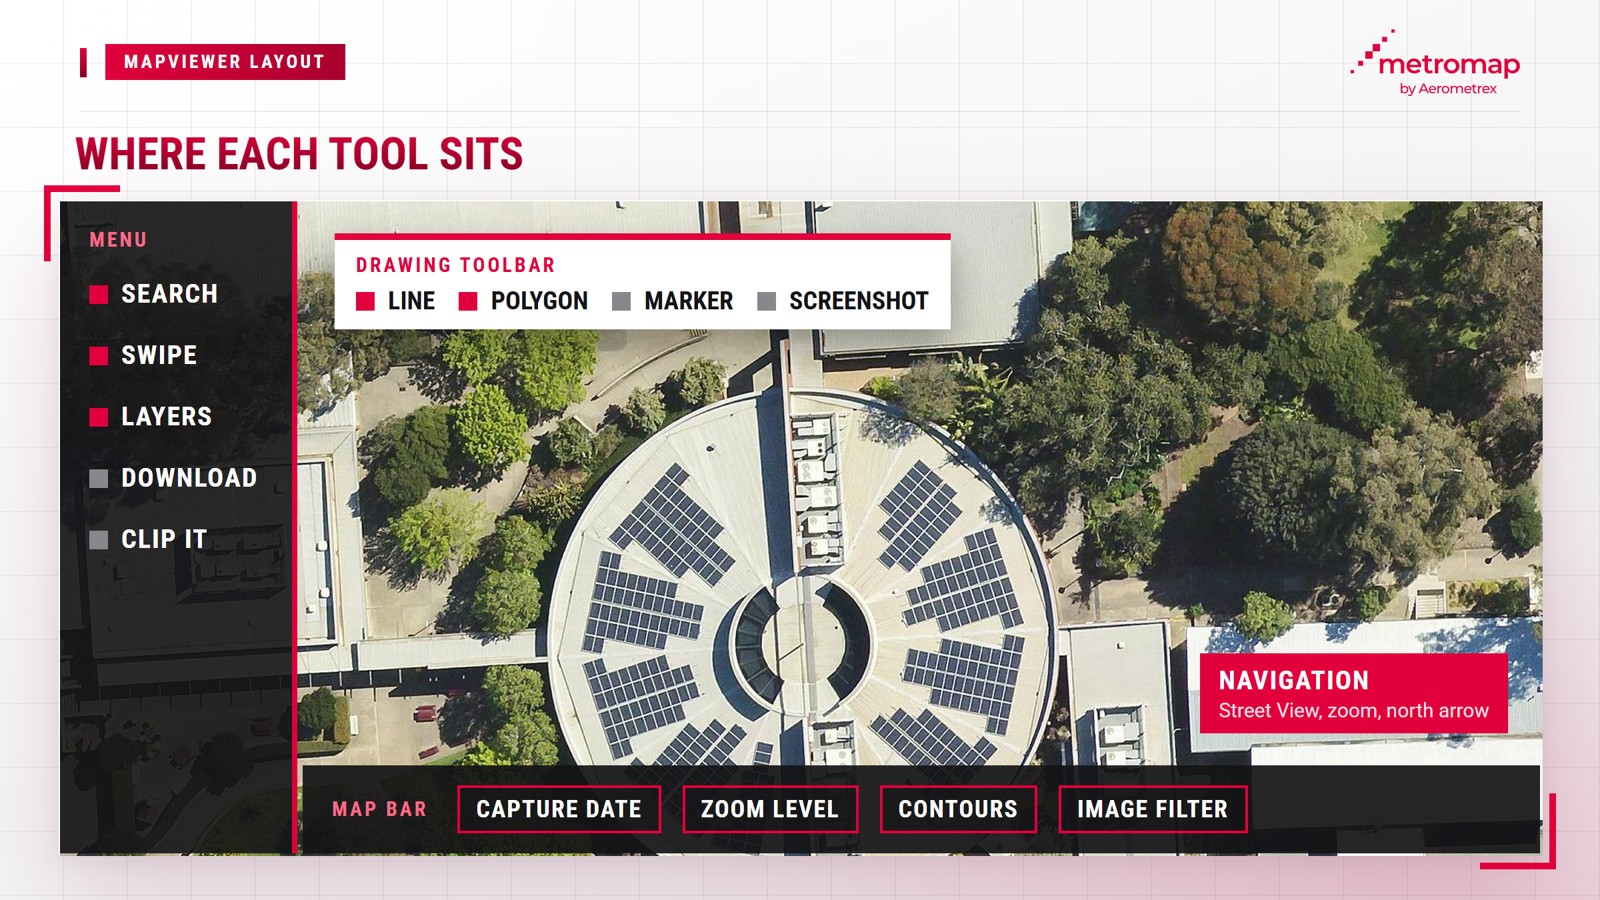
MapViewer organises its tools into four areas of the screen. The menu contains search, downloads, Swipe, layers and settings, while a movable toolbar contains drawing and screenshot tools. The bottom map bar displays the capture date, zoom level, contour toggle and image filters for colour, contrast and sharpening. Navigation controls in the lower-right corner include Street View, zoom and the north arrow.
Most tools are included across all MetroMap plans, with search, measurement, Swipe and downloads available on Pro, Team and Enterprise. However, the circle tool and layer buffers are exclusive to Enterprise.
The elevation profile and Obliques features are currently in beta and may undergo further refinement. Daniel O'Donnell, MetroMap's Head of Product, demonstrates the practical application of these tools in an on-demand MapViewer walkthrough.
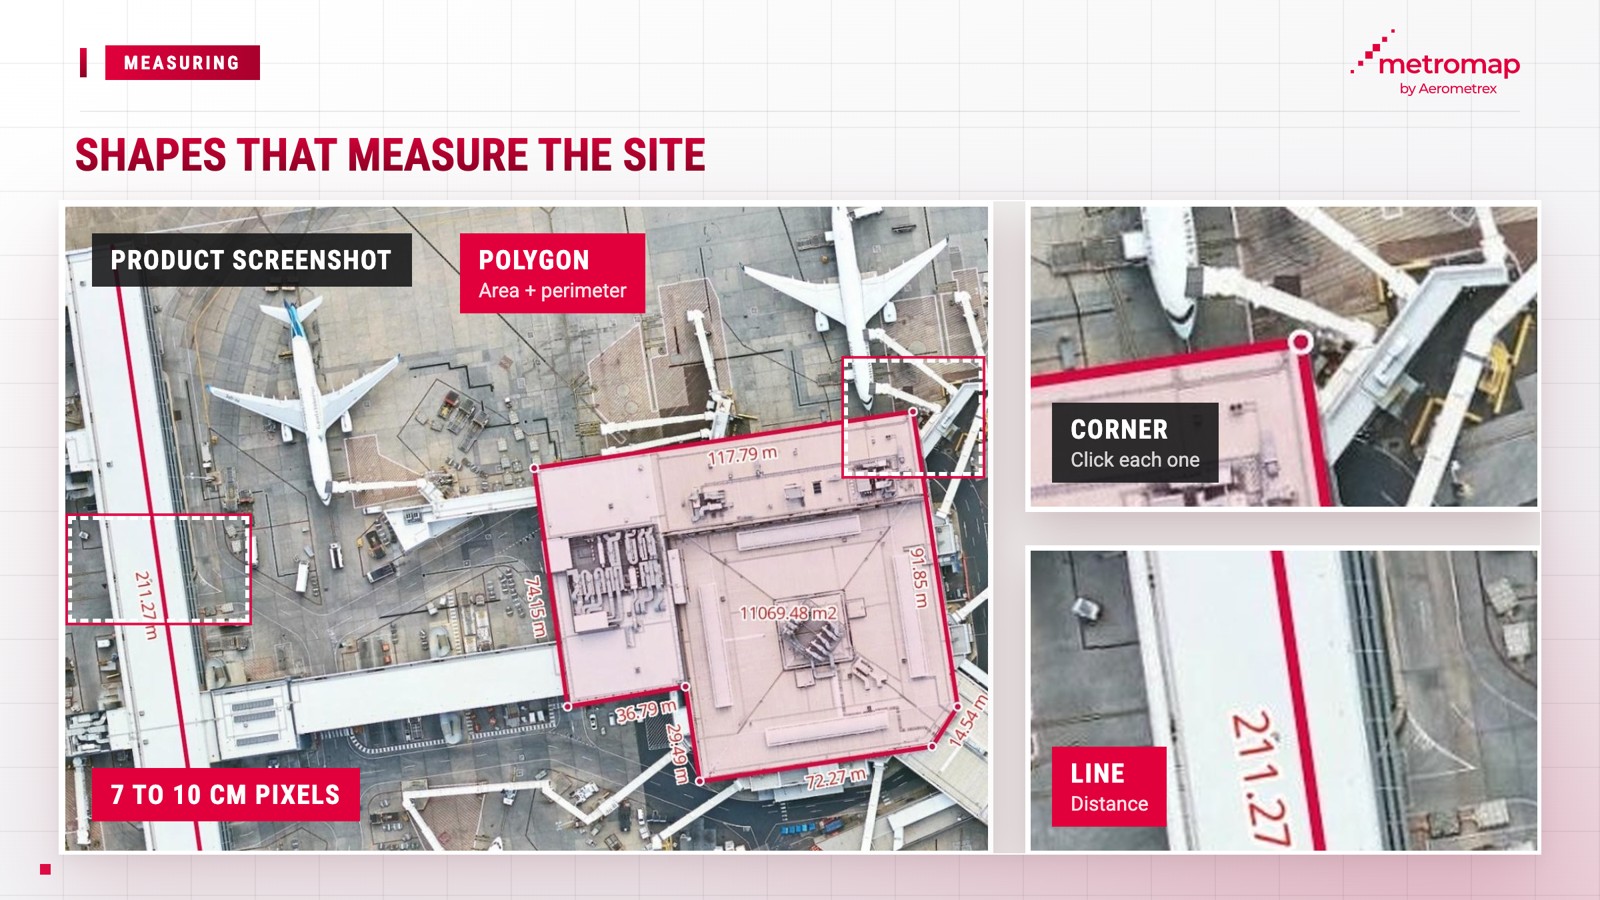
MapViewer enables measurements directly on aerial imagery. The line tool calculates distances, while the polygon tool measures roof area and perimeter by tracing its outline remotely. For historical comparisons, the Swipe tool displays two captures of the same location side by side, allowing users to identify changes without conducting a site visit.
MetroMap imagery has a Ground Sample Distance (GSD) of 7 to 10 cm per pixel, with an absolute horizontal accuracy of 3 pixels Root Mean Square Error (RMSE), a standard measure of positional error. This corresponds to approximately 21 to 30 cm on the ground. Users can measure roofs, land parcels or driveways using the following steps:
The Swipe tool allows users to compare imagery of the same area captured on two different dates. MetroMap captures capital cities up to 6 times annually and maintains imagery archives spanning 20 years or more in some locations, allowing multiple historical captures to be reviewed. To compare two capture dates, follow these steps:
The ability to compare historical imagery is also highlighted by Richard Lemon of Jacobs, who states: "The web interface is easy to use, reliable and provides the ability to view & compare multiple epochs which is very helpful."
For ongoing site monitoring, MetroMap's Watchpoint feature sends email notifications when new imagery becomes available for a saved area, allowing users to track new captures without repeatedly checking the platform.
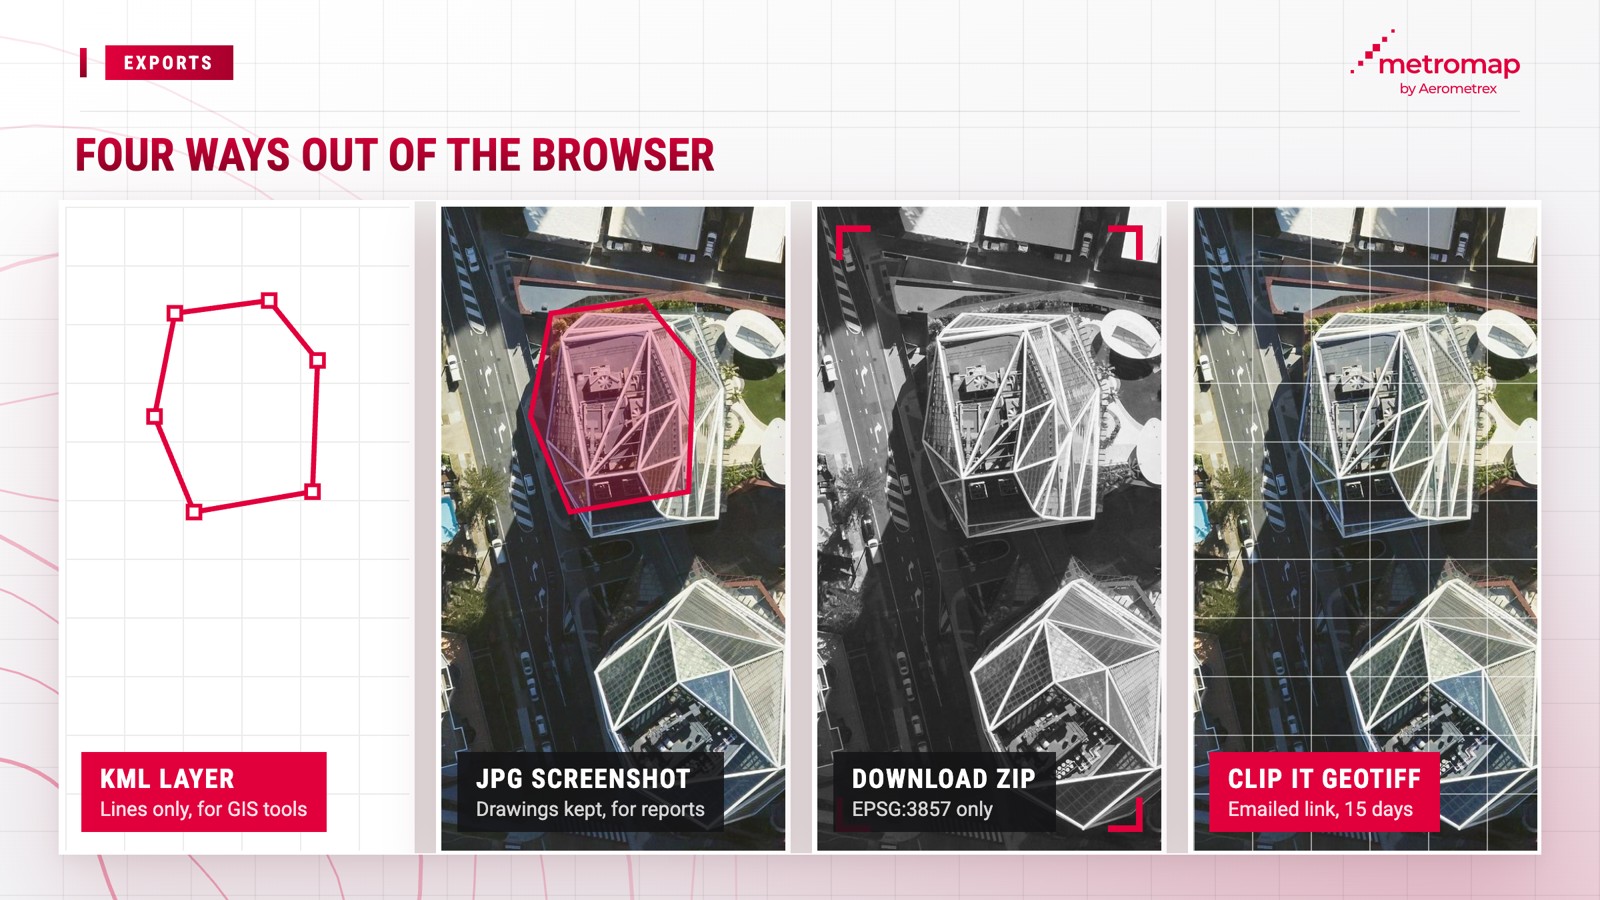
MapViewer supports three main methods for exporting work to other software. Saved layers can be exported as KML files, while the Screenshot tool generates JPG images. The Download and Clip It tools export georeferenced imagery that retains its geographic position. Clip It supports GeoTIFF, Geospatial PDF, JPEG, PNG and IMG formats.
Each export serves a different purpose, from annotated imagery for quotes to georeferenced files for GIS applications:
For desktop GIS and CAD applications requiring accurate image alignment with plans, a Clip It GeoTIFF embeds geographic positioning within the file, consistent with the OGC standard for exchanging georeferenced imagery. To export a GeoTIFF using Clip It, follow these steps:
MetroMap also supports data imports through the Layers panel, accepting GeoJSON, KML, KMZ and zipped Shapefile formats. Users can import multiple files simultaneously, each up to 20 MB, and overlay their own site plans onto MetroMap imagery.
MapViewer distinguishes between viewing and downloading imagery. Users can view, measure and annotate imagery within the platform, while Download and Clip It export image files for offline use. Downloads require a paid MetroMap subscription, as the 7-day Pro trial includes access to imagery and tools but excludes image downloads.
Desktop GIS software is more suitable than MapViewer for tasks requiring analysis across multiple data layers or comprehensive elevation data. MapViewer supports viewing, measuring and annotating aerial imagery within a browser, whereas desktop GIS applications, such as ArcGIS and QGIS, are designed to integrate and analyse multiple datasets.
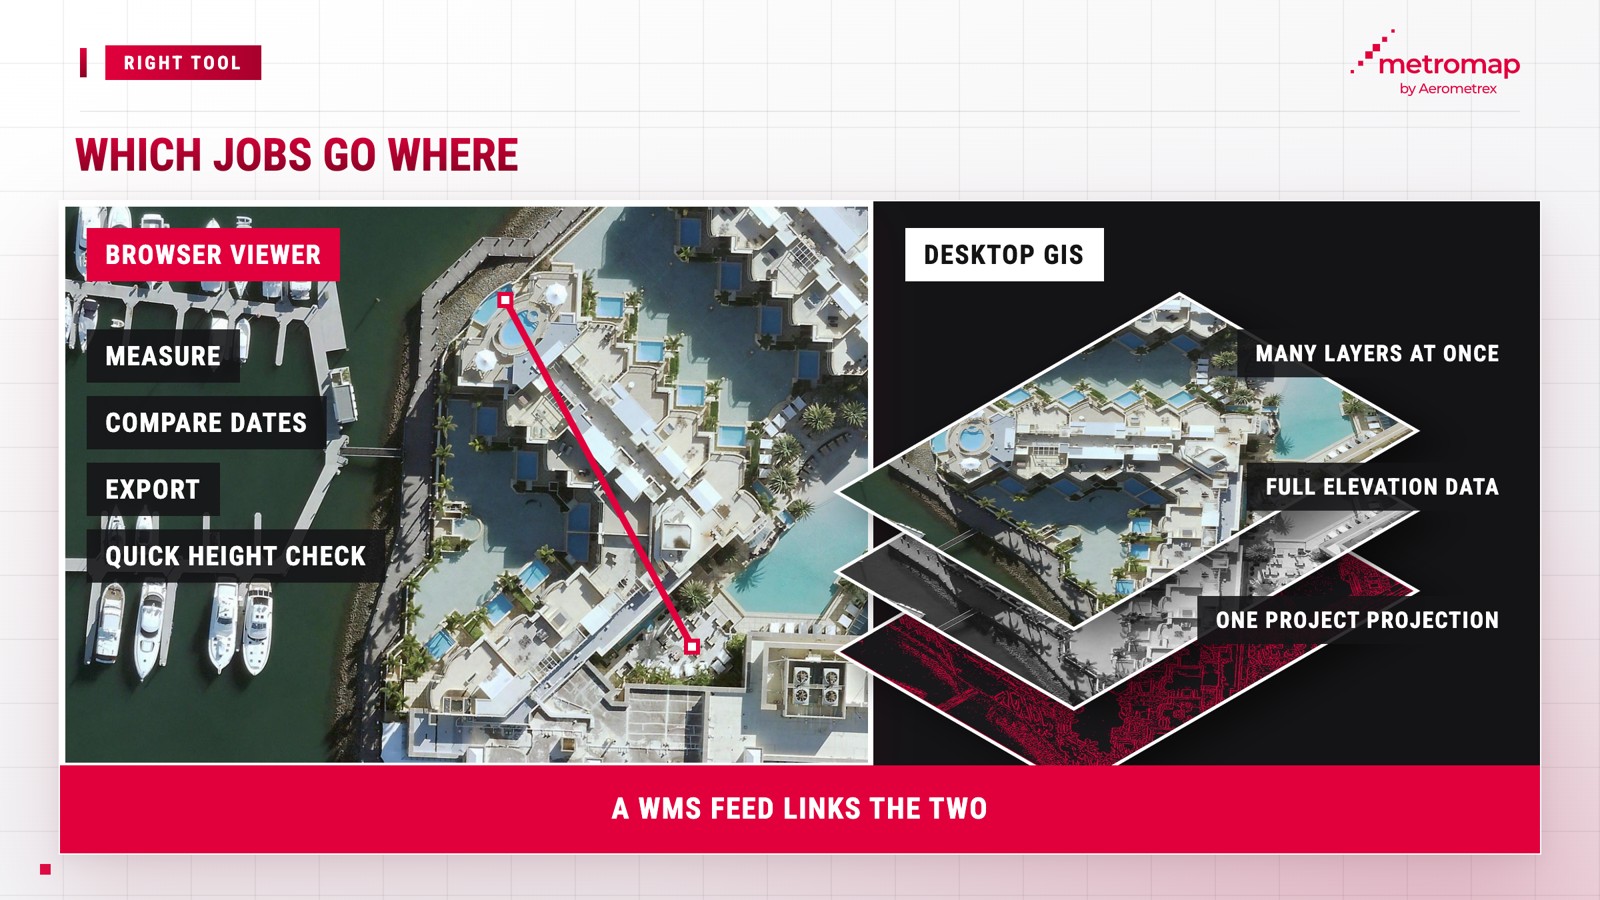
MapViewer's browser-based tools have several limitations that may require the use of desktop GIS software:
The Elevation Profile Tool uses the Australian Height Datum (AHD) as its national height reference. Geoscience Australia defines this datum using mean sea level measurements "at 30 tide gauges around the coast of the Australian continent".
MapViewer and desktop GIS software can be used together. Clip It GeoTIFF files support offline analysis in desktop GIS, while MetroMap Enterprise plans offer optional WMS and WMTS feeds and MetroMap Image Dedicated for ArcGIS to stream imagery directly into GIS applications. WMS is an OGC standard that specifies a "simple HTTP interface for requesting geo-registered map images".
MetroMap Pro costs $2,640 annually, including GST, while the Team plan costs $6,999 annually, including GST, based on annual payments. Enterprise plans are available, with pricing quoted upon request. All MetroMap plans have a 12-month subscription term, with monthly or annual payment options.
| Plan | Price (incl. GST) | Named users | Tools and extras |
|---|---|---|---|
| Pro | $2,640 a year (paid annually) ($220 a month equivalent) | 1 | MapViewer toolkit without the circle and buffer tools, unlimited data under fair use |
| Team | $6,999 a year (paid annually) | Up to 5 | Everything in Pro, at the equivalent of $116.65 per person a month for 5 users |
| Enterprise | Contact MetroMap for a quote | Custom | Circle and buffer tools, WMS/WMTS, MetroMap Image Dedicated for ArcGIS (optional), onboarding and training webinars, a dedicated account manager |
Annual payments offer a 17% saving compared with monthly payments, and all MetroMap plans include online support and in-app tooltips.
The MetroMap plans page provides a feature-by-feature comparison. MetroMap also offers a 7-day free trial of the Pro plan without requiring a credit card, although image downloads are excluded.
MetroMap covers areas inhabited by 94% of Australia's population, including capital cities, regional areas and many remote locations. Capital cities are captured up to 6 times annually, while regional areas are captured approximately once a year. Some locations also have historical imagery archives spanning 20 years or more.
At lower zoom levels, MapViewer displays boundary lines indicating MetroMap imagery coverage. At higher zoom levels, the bar beneath the map displays capture dates as the cursor moves, enabling users to assess imagery recency before taking measurements.
MetroMap captures aerial imagery throughout the year. In FY2026, its partners, subcontractors and Aerometrex-operated aircraft captured 2.2 million frames. MetroMap is 100% Australian owned and operated.
MetroMap Obliques offers imagery from four viewing directions, capturing building facades and access points in "high-density capital city areas". Its geographic coverage is therefore more limited than vertical imagery. Where oblique imagery is unavailable, users can still access vertical imagery and Google Street View through MapViewer, with Street View imagery supplied by Google.
Yes, MetroMap downloads are available on paid plans, though not in the free 7-day trial. The Download tool saves a ZIP file with its map position, and Clip It sends high-resolution files by email in several formats.
MapViewer imports GeoJSON, KML, KMZ and zipped Shapefile files. Saved layers export as KML files, an open standard from the Open Geospatial Consortium.
MapViewer supports the latest versions of Chrome, Firefox, Safari and Edge, with Chrome the preferred browser.
Yes. The Location Sharing tool sends a link to a marker by email or as a copied link. Zoom levels 19 to 21 give the clearest view.
No. The Elevation Profile Tool graph can be copied as an image, but its data can't be exported. Only the latest elevation data shows for each place.
Every MetroMap plan includes online help pages and in-app tool tips. Enterprise plans add onboarding and training webinars from MetroMap's team.
View the world from our eyes ! Here we share some exciting images from across MetroMap