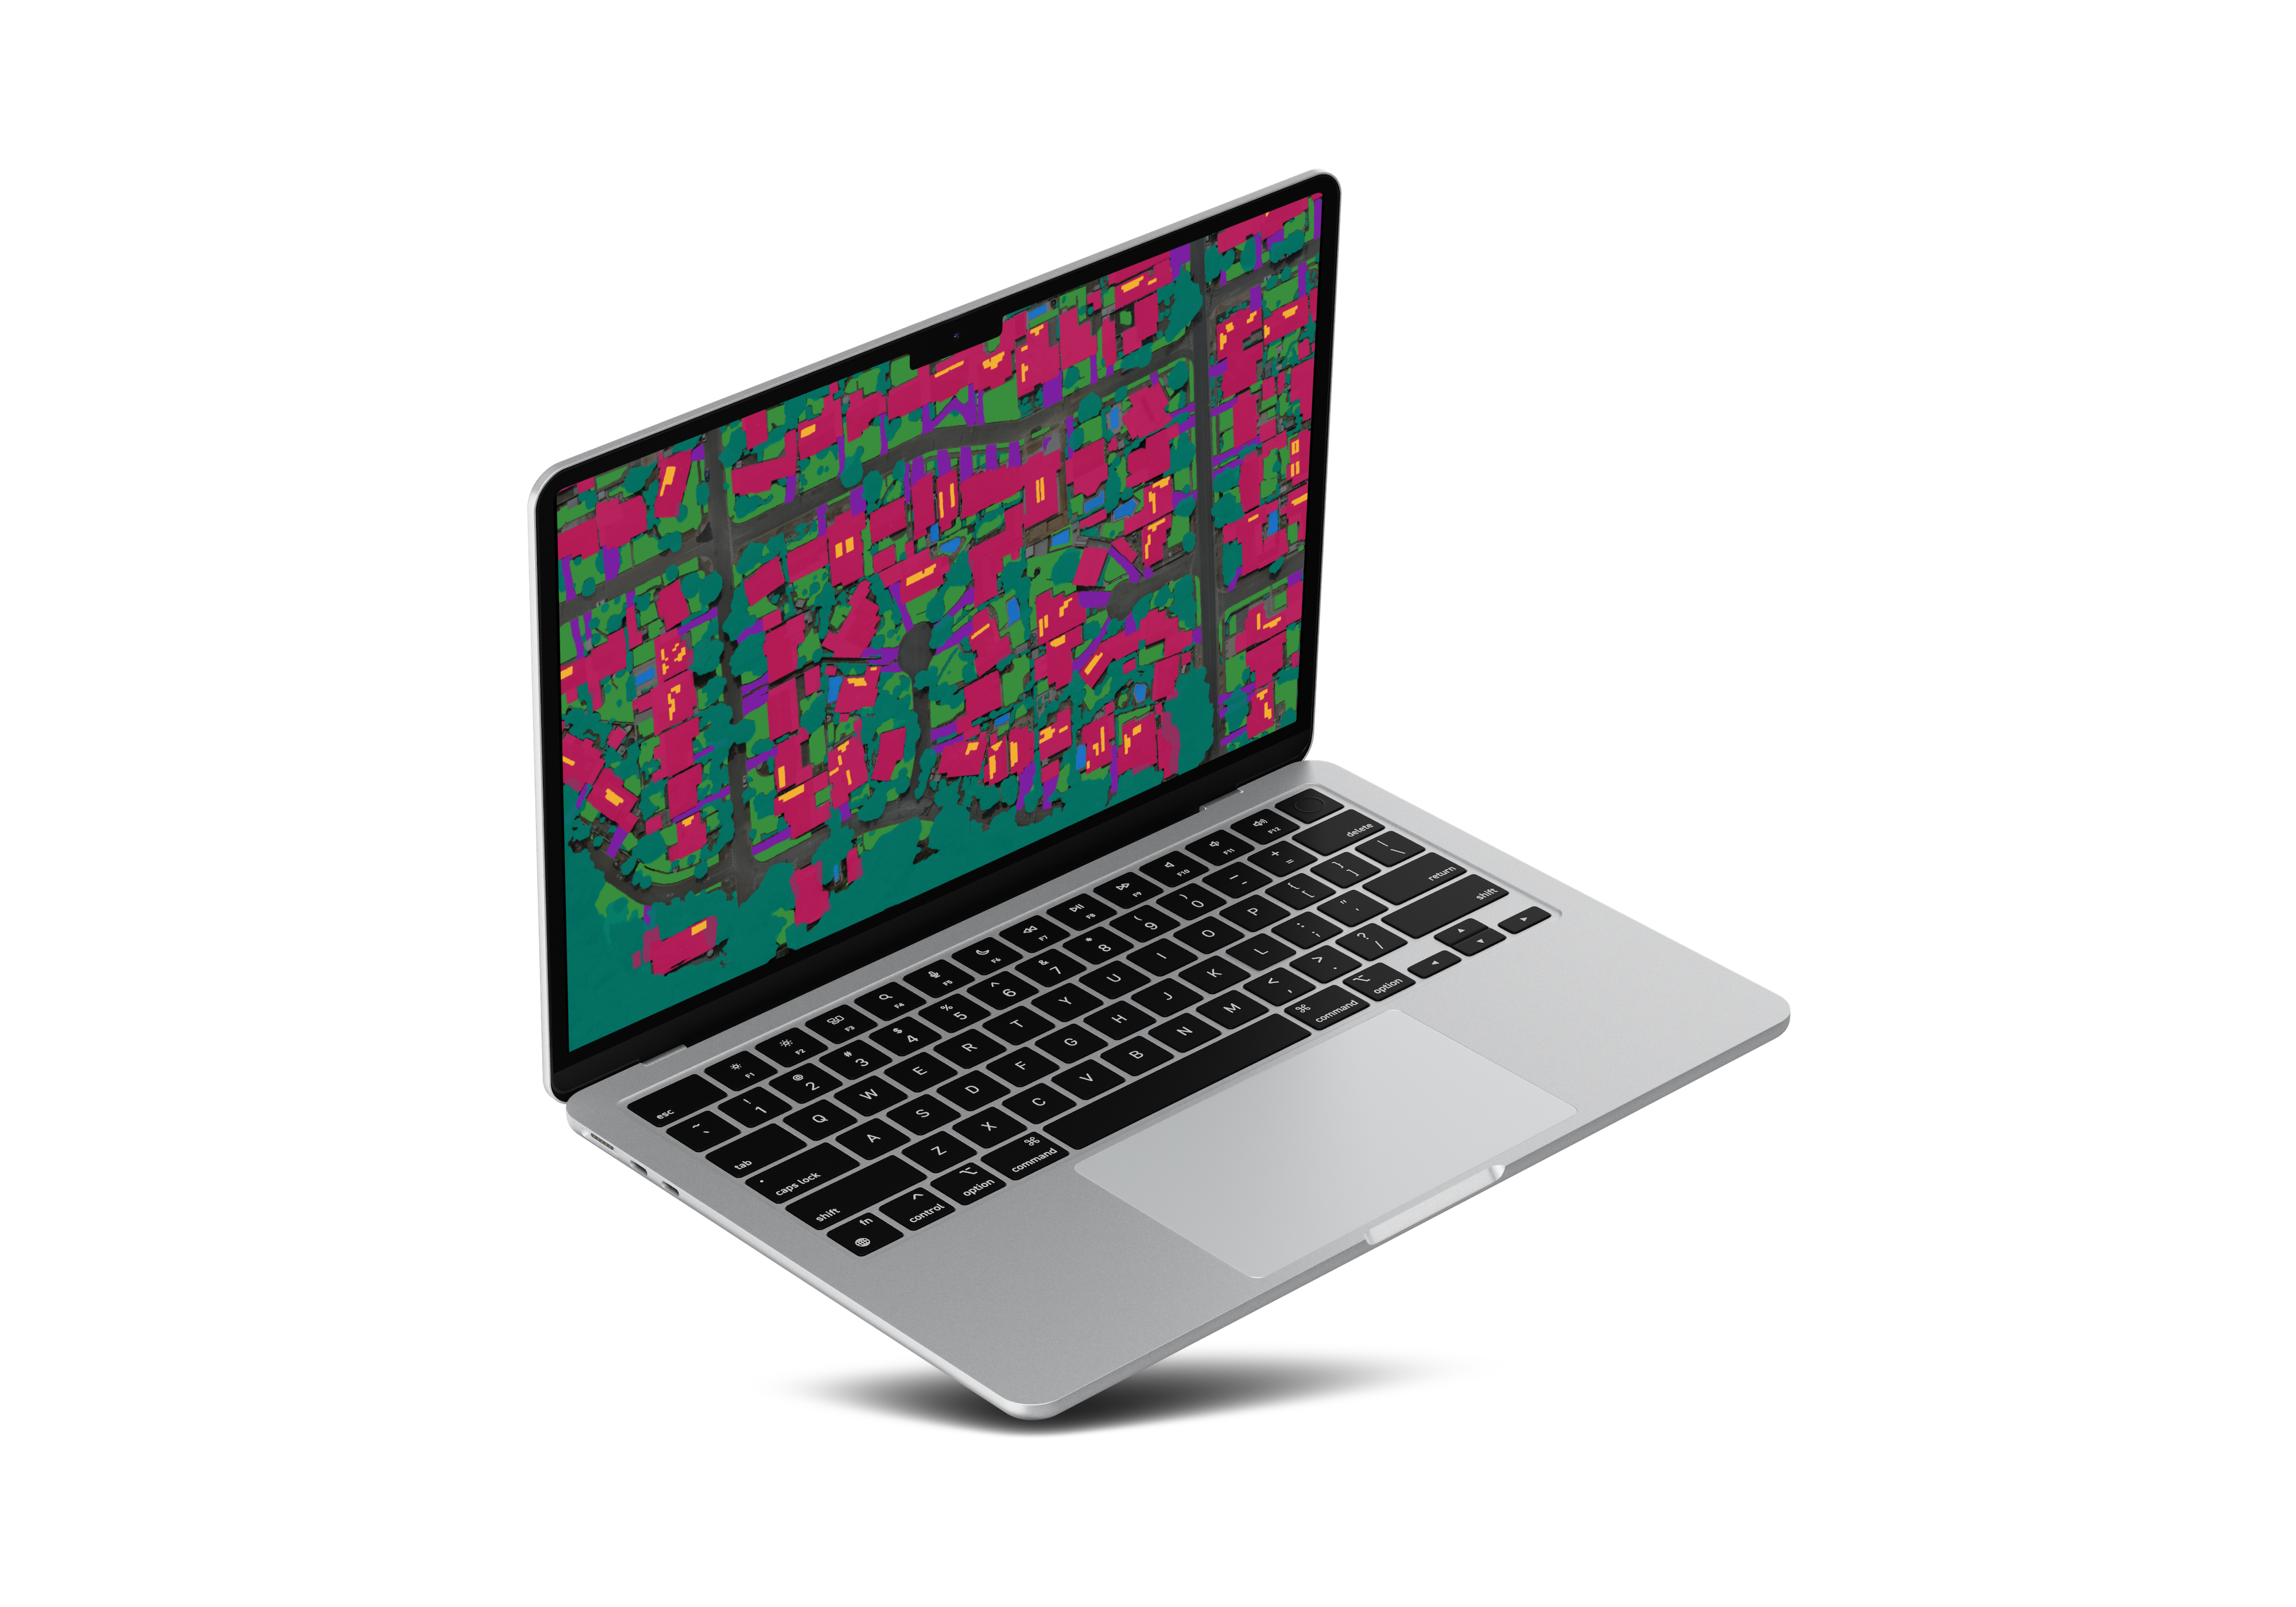
MetroMap Insights empowers you to make informed decisions about your urban environment by leveraging the power of past and current aerial imagery. By analysing data from different points in time across the whole of Australia, our insights can help you better understand changes and trends in your area of interest.
With these valuable insights, you can plan for the future, anticipate changes, and stay ahead of the competition. Whether you’re in GIS, asset management, infrastructure development, urban planning, or environmental management, MetroMap Insights can help you make data-driven decisions that lead to success.
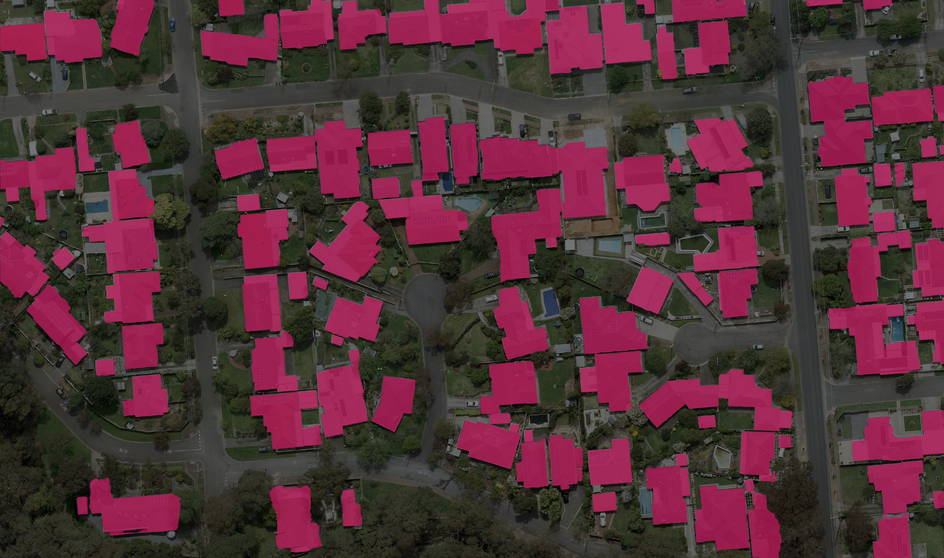
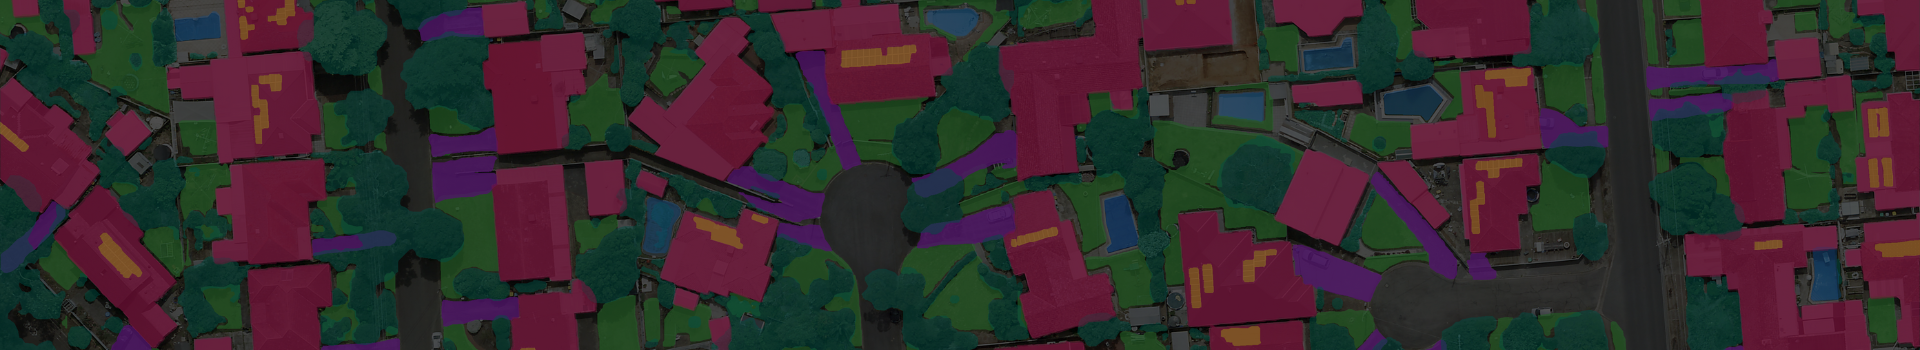
This feature, extracted from MetroMap aerial imagery represents the area covered by a residential, commercial, or industrial building, and is available as a polygon layer for use in most common GIS software. Monitor building approvals vs actual or view trends in urban growth to derive intelligence.
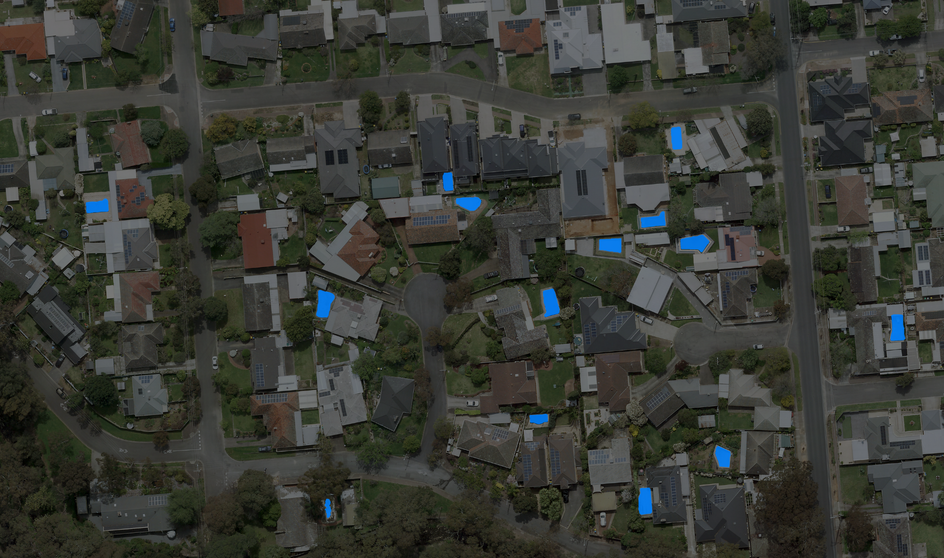
This feature represents the area covered by swimming pools, capturing even covered, empty, and dirty pools. Useful for monitoring pool installations, safety audits, and identification of opportunities for pool-allied businesses such as pool capping, cleaning, fencing, maintenance, and many more.
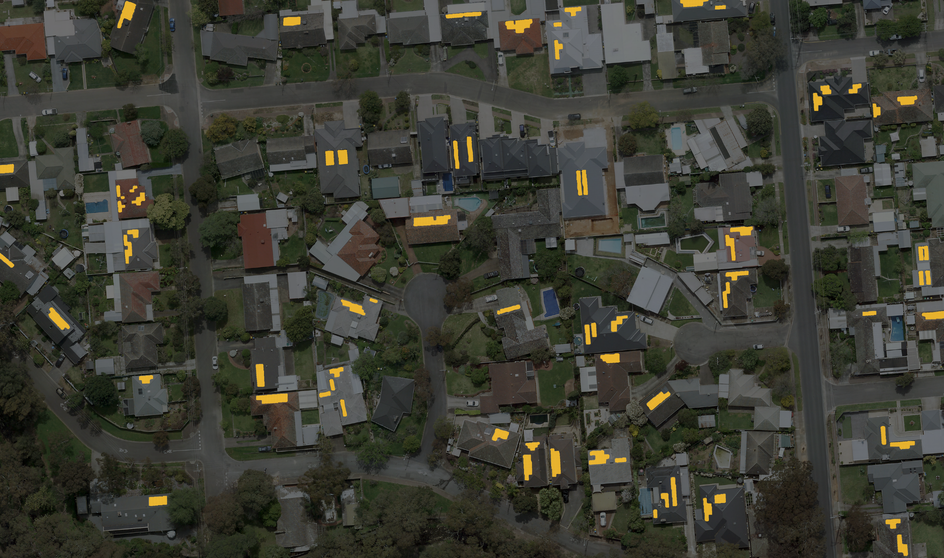
This feature represents the extent of solar arrays present on the roof. Great for a targeted approach to reach your potential market for solar installations and allied businesses. Use data to view change across time, or simply access a CSV file with address and other details for solar installations.
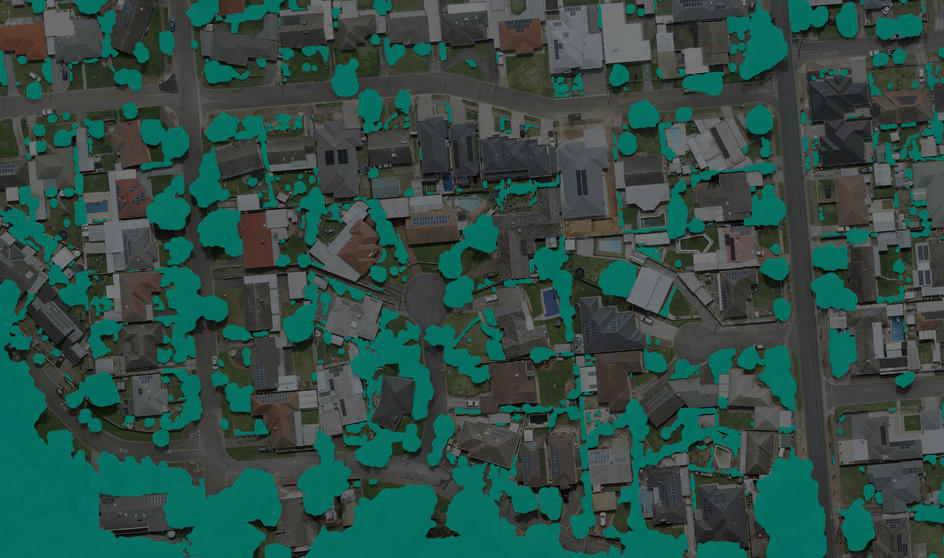
This feature represents coverage of trees in an area. It captures medium and high vegetation. Using data from multiple years, you can review growth/reduction in vegetation, and drive policy decisions and greening targets. It can also help plan for maintenance activities linked to ageing of trees.
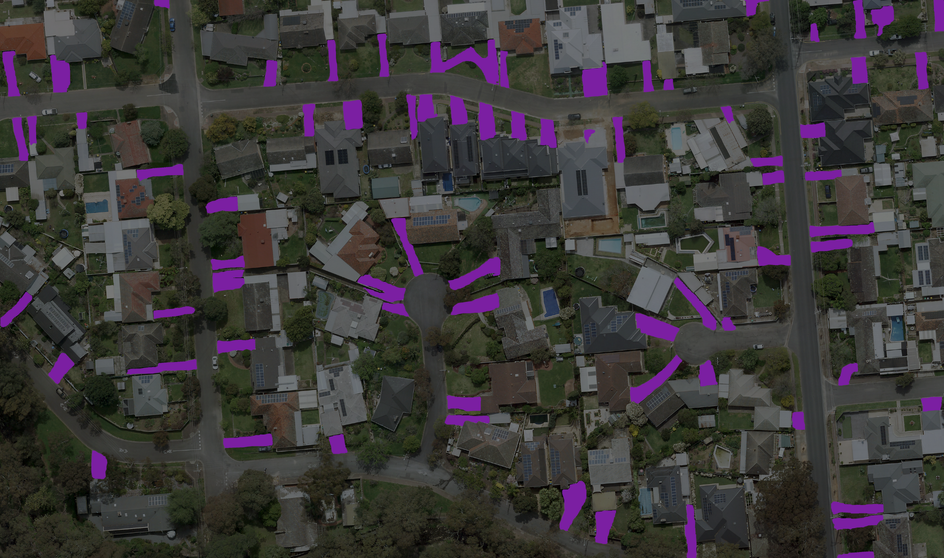
This feature represents driveways that lead from public streets to buildings. They may be made of various materials including concrete, asphalt, gravel, and pavers. This data can help identify the condition of driveways, opportunities for maintenance and resurfacing businesses, and other use cases.
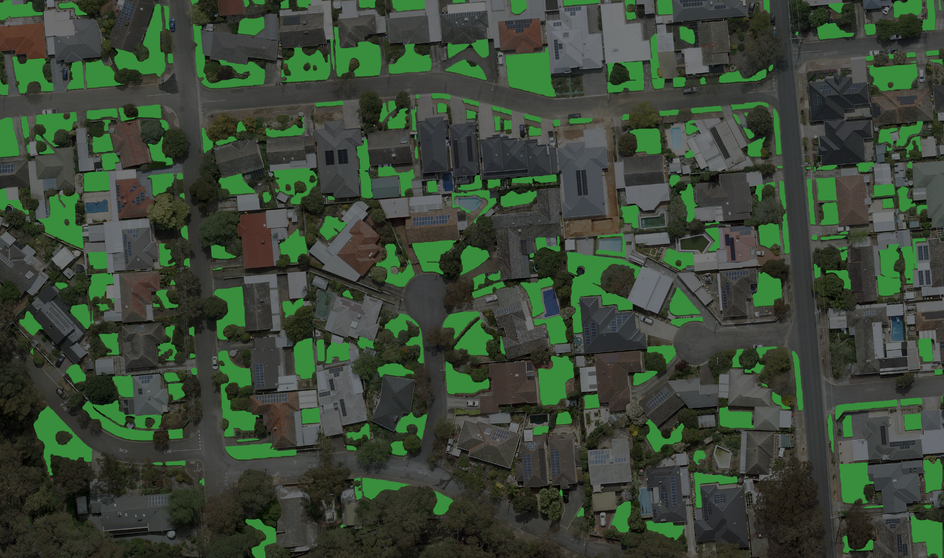
This feature represents the area covered by grass, lawn, and artificial turf present around a property. Useful not only for monitoring the cleanliness of properties from a health & safety aspect but also for identification of potential customers for lawn maintenance and other allied businesses.