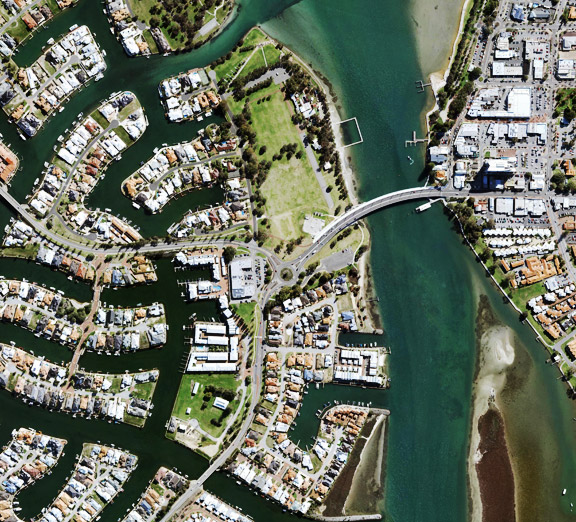
Aerial photography is a mapping method that captures the earth's surface from above, via drones, satellites or aircraft. Aerial photography captures the ground from the air on a known date, with each photo tied to map coordinates, so distances and areas can be measured on screen. MetroMap captures vertical (nadir) imagery looking straight down, and oblique imagery tilted about 45° to show the sides of buildings.
| Plane | Drone | Satellite | |
|---|---|---|---|
| Area per capture | A whole city or region | One site or a small area | A whole country |
| Ground Sample Distance (GSD) | Centimetres | Set by flying height and camera | 10 to 60 m |
| When it is flown | On a set plan, several times a year in big cities | Whenever the pilot flies | Regular passes from orbit |
| Flight restrictions | Planned flight lines, shared airspace | Under 120 m, in sight, 30 m from people | No flight for the user |
| When a drone or satellite is better | The site is not yet on the flight plan | One site needs a fresh capture now | A broad look at remote land is enough |
Planes capture imagery across entire cities according to planned schedules, drones capture individual sites on demand, and free satellite imagery provides nationwide coverage at 10 to 60 m GSD per pixel. For councils, trades and planners, the appropriate method depends on the area requiring coverage and the level of detail needed. MetroMap’s repeated plane captures enable teams to measure roofs and land parcels across a city remotely from the office.
The main types of aerial photography are vertical (nadir) and oblique, and the camera angle sets them apart. A vertical image points straight down and reads like a map, while an oblique image is tilted, about 45° for MetroMap Obliques, so it shows walls as well as roofs. Some captures also record near infrared light.
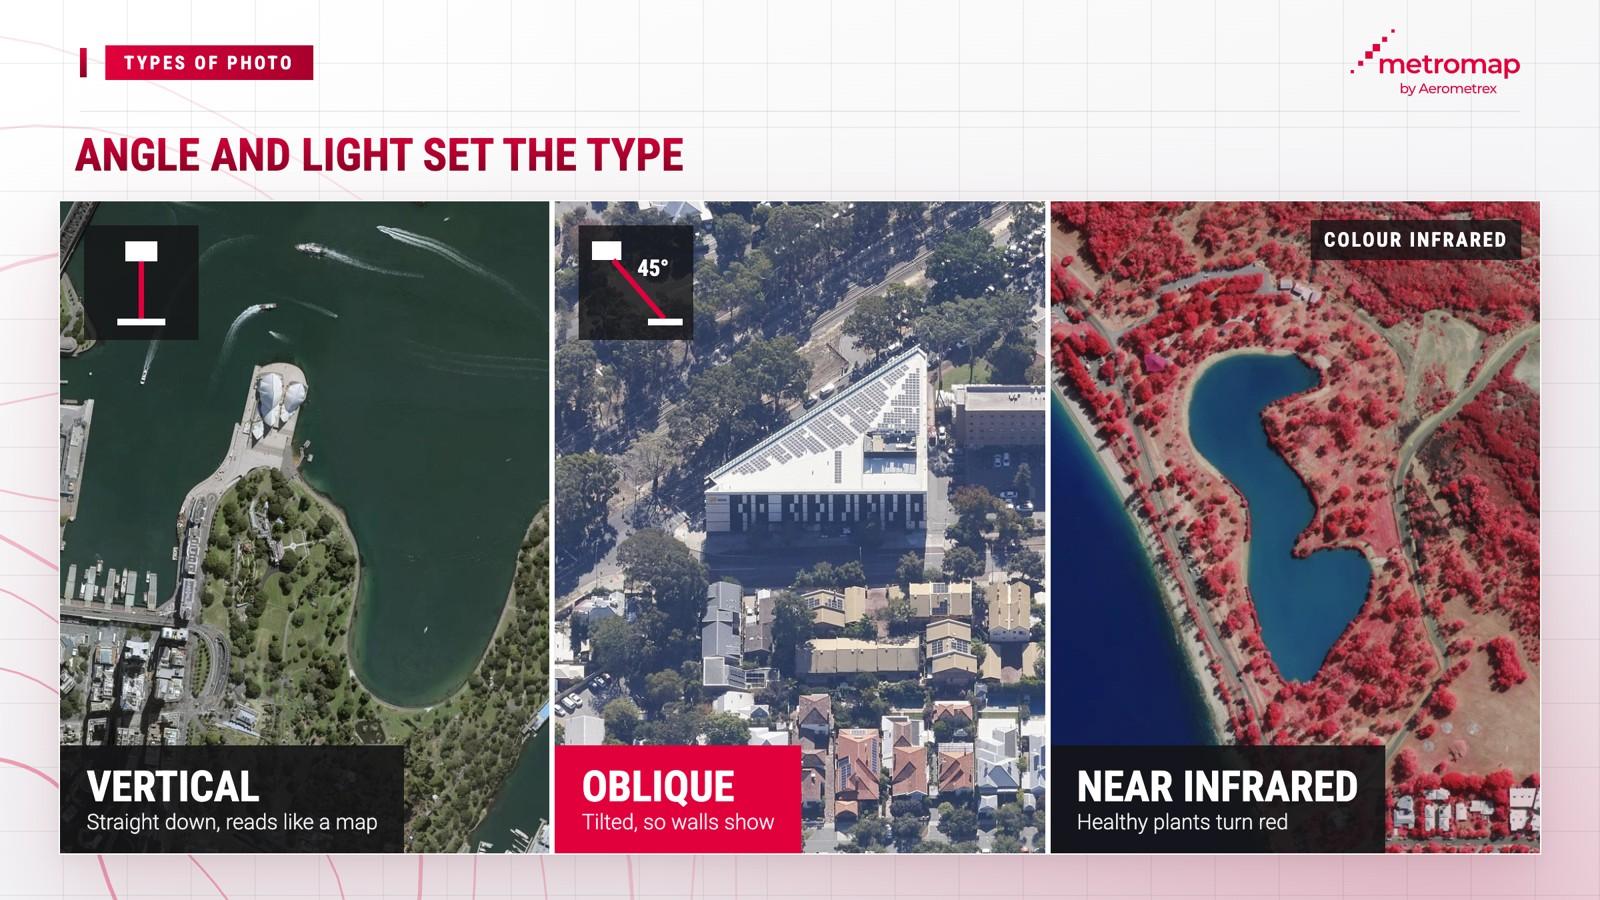
Vertical imagery is the base for measuring, because its straight-down view keeps the scale steady from one edge of the image to the other. That is why the main MetroMap layer is vertical.
MetroMap imagery is 7 to 10 cm of ground area per pixel. This is referred to as Ground Sample Distance, or GSD. For example, at 7 cm GSD, one pixel in the image will equal a 7x7 cm area on the ground.
Oblique imagery adds what a roof or a tree hides, and MetroMap Obliques are captured from the north, south, east and west, each at about 45°.
MetroMap Obliques show what a straight-down view misses: building facades, access points and details hidden beneath tall buildings and trees. That makes them useful for assessing building materials and the condition of a site, and for five common jobs: site planning and feasibility, property and asset inspections, condition and access checks, change monitoring, and stakeholder communication and approvals.
MetroMap oblique imagery covers select areas in Adelaide, Sydney, Melbourne, Brisbane, Perth, Canberra, Darwin and Tasmania. Capture dates for oblique imagery vary by area, and may be older than vertical imagery captures.
Some MetroMap imagery is also available in a colour infrared view. Colour infrared (CIR) uses 4-band imagery, which adds a near-infrared band to the standard colour (RGB) bands. Your eyes can't see near infrared, so the colour infrared view displays it as red. Healthy plants reflect a lot of near infrared, which is why they show up bright red, while dry or diseased vegetation appears pale green or grey.
That makes colour infrared useful for checking vegetation and crop health, managing fire risk and bushfire recovery, and monitoring soil composition.
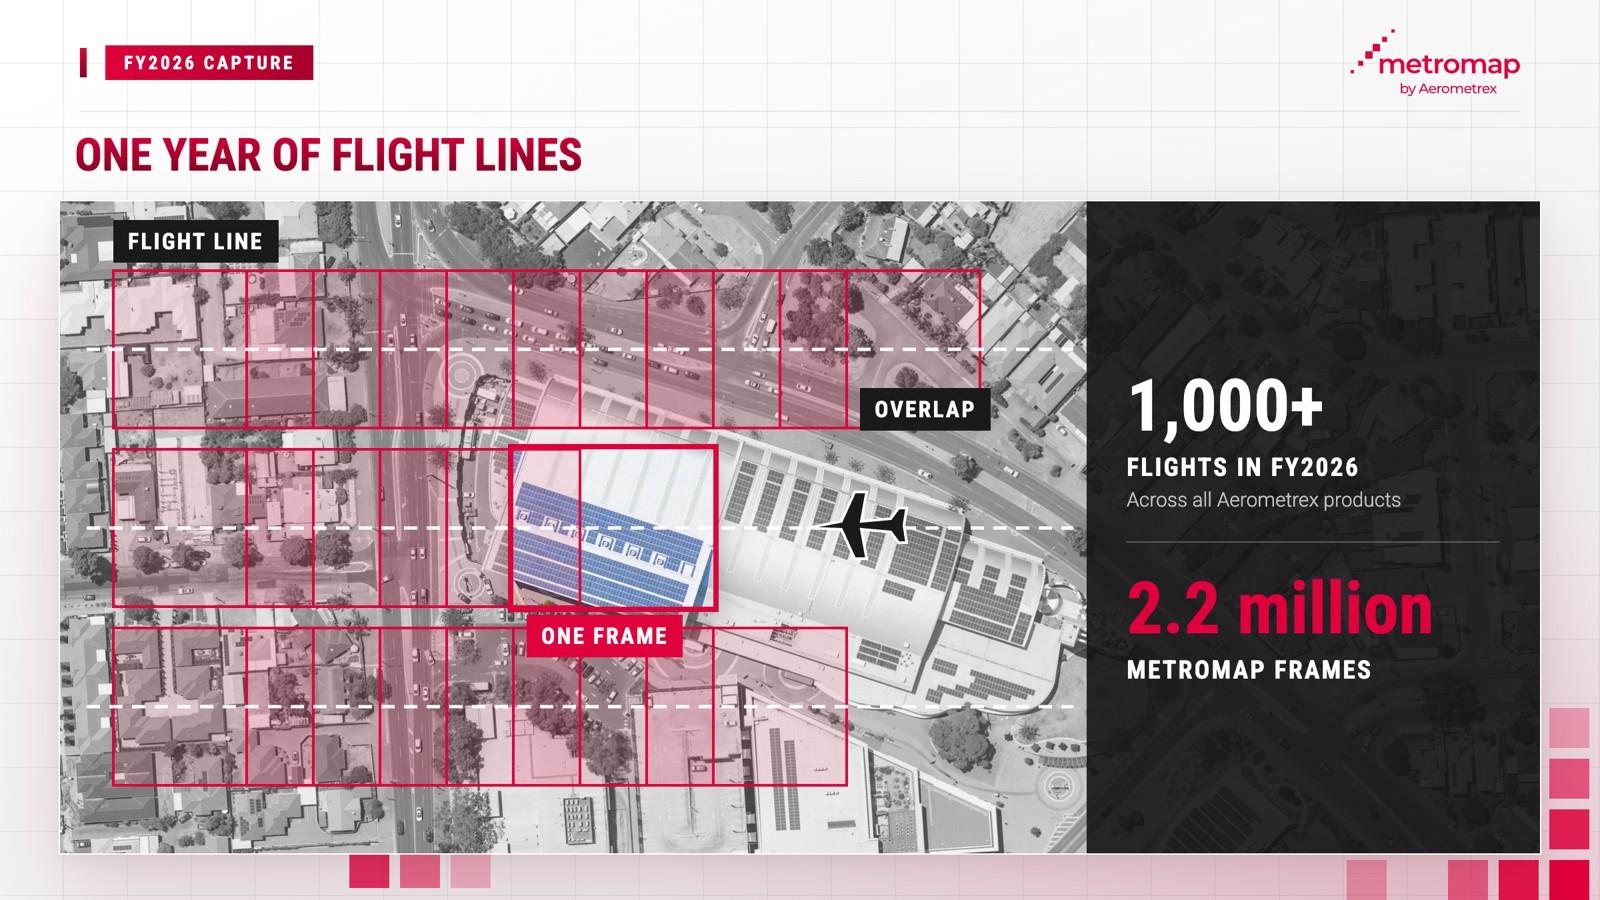
Aerial imagery is captured using planes, drones or satellites, with each method covering a different geographic area. MetroMap imagery is captured by Aerometrex planes, as well as its partners and subcontractors. Planes follow predetermined flight paths across a city, with cameras capturing images at set intervals to ensure each frame overlaps with the preceding one.
A city-wide imagery capture involves four stages:
The scale of imagery collection is substantial. In FY2026, more than 2.2 million individual frames were captured for MetroMap.
The choice of imagery capture method depends on the area being surveyed. Planes capture imagery across entire cities according to scheduled flights, while drones capture individual sites whenever a pilot conducts a flight. In contrast, free satellite imagery covers the entire country but at a significantly lower resolution.
Digital Earth Australia's guide puts each Landsat satellite pixel at 30 x 30 m of ground, and each Sentinel-2 pixel covers 10 x 10 m to 60 x 60 m, depending on the band. In contrast, MetroMap imagery captures between 7-10 cm GSD. Drone imagery can provide very high resolution imagery as it is closest to the ground.
Aerial photography is limited by weather, flight rules, the trade-off between detail and coverage, and the age and accuracy of each photo. MetroMap's flight planners schedule each flight to limit the effect of cloud, rain and bushfires, and every image records a site as it was on its capture date.
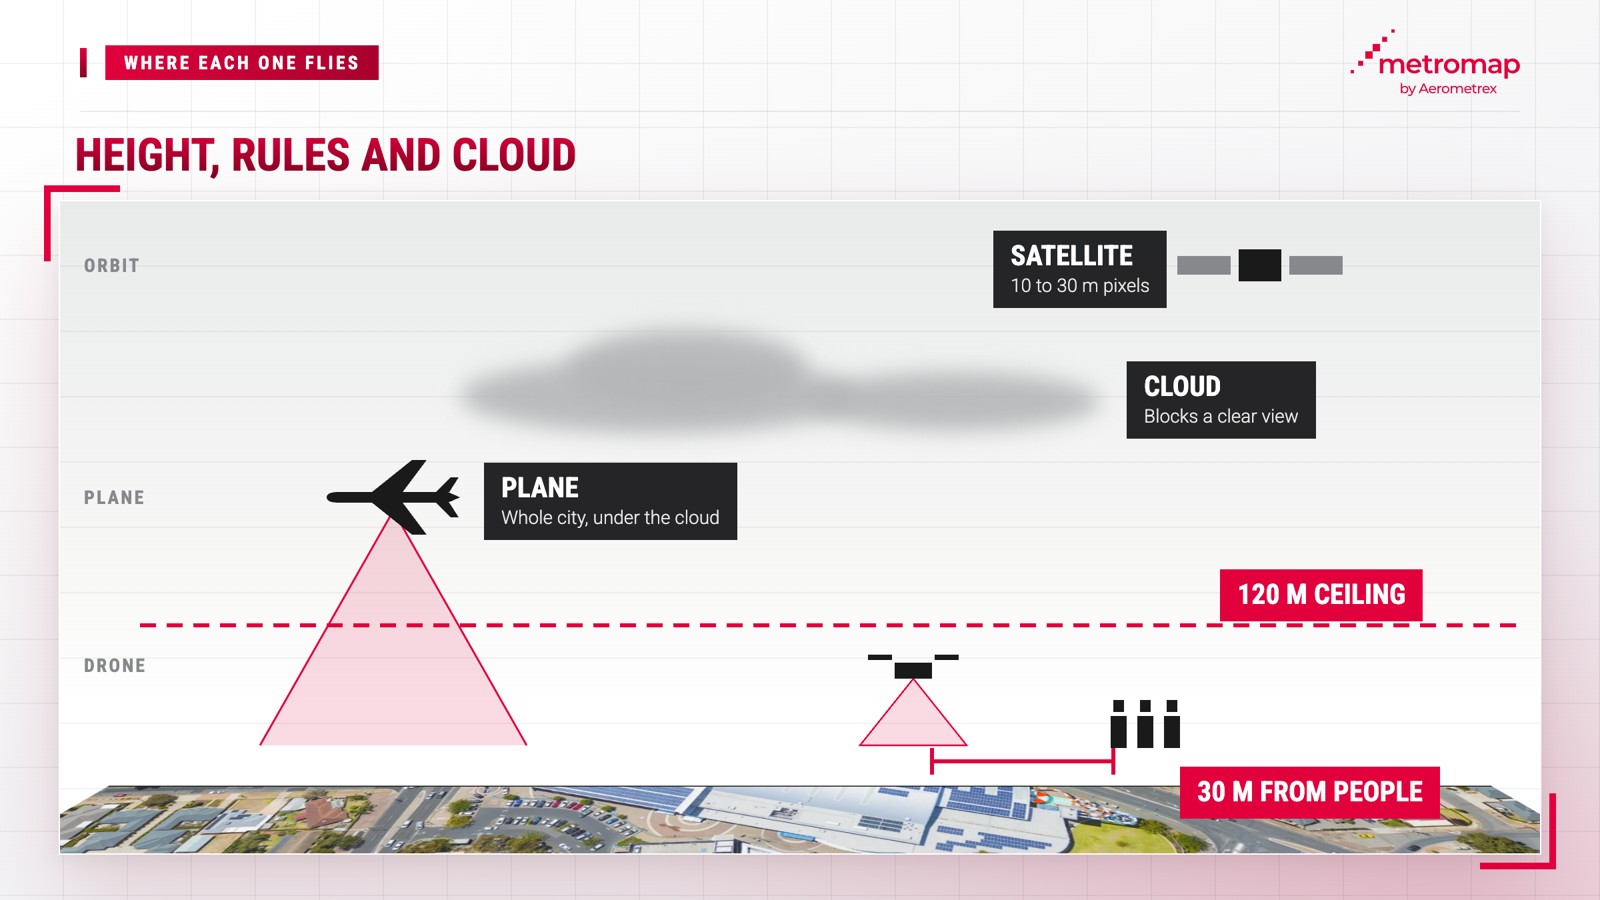
Each limitation arises from specific factors:
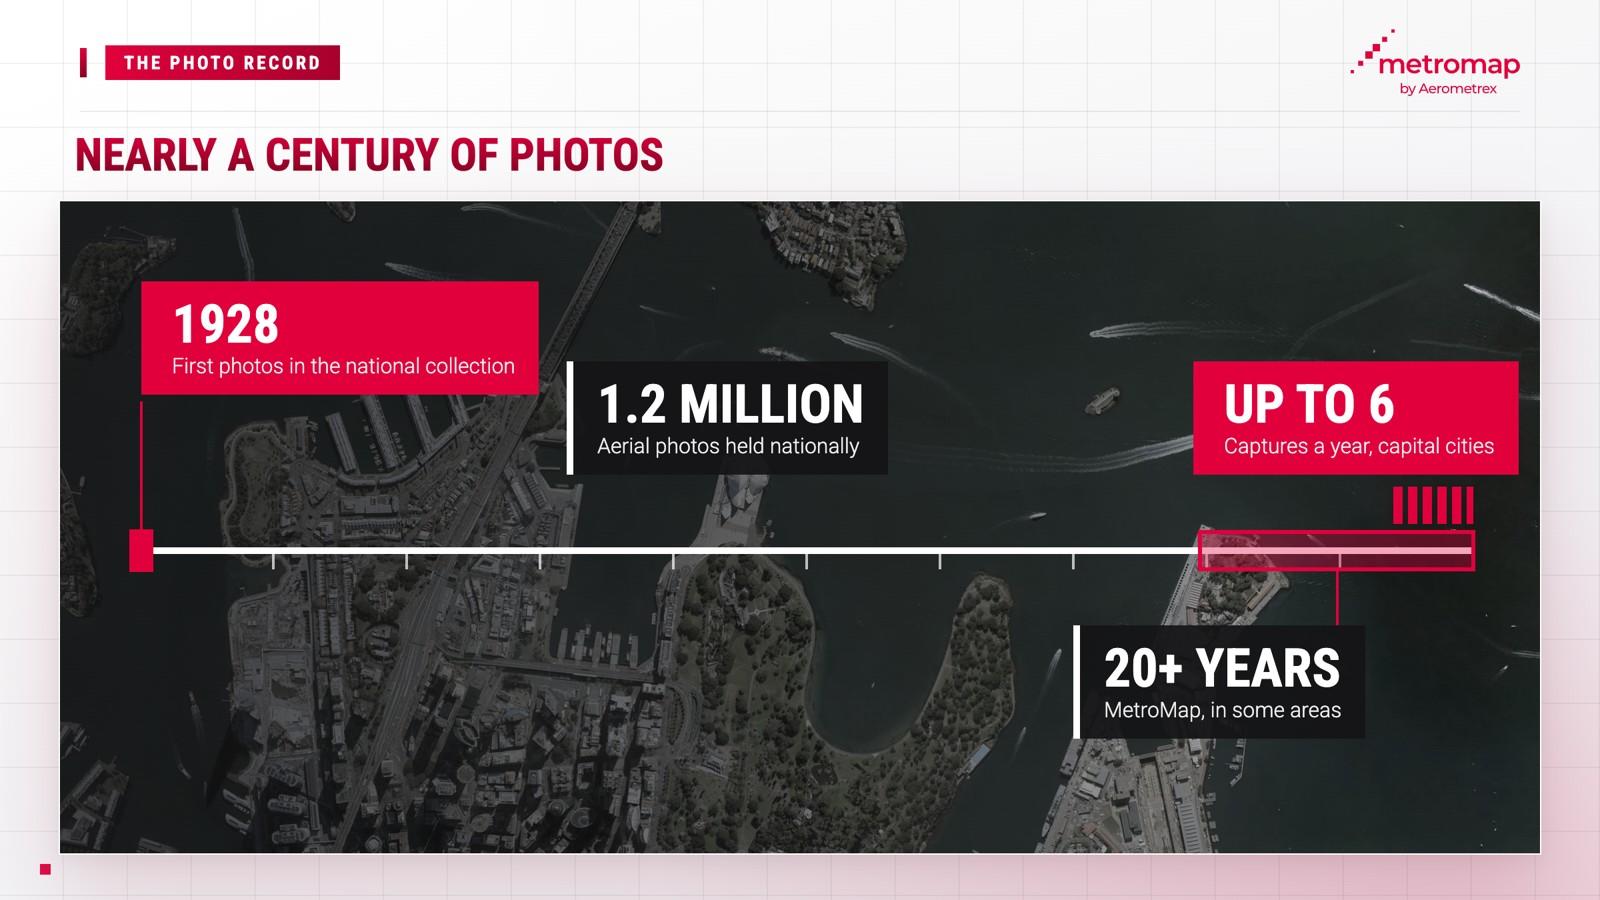
Aerial photography provides a dated visual record of a location, making it possible to assess site conditions and track changes over time. MetroMap maintains imagery archives spanning 25 years or more in some areas, enabling councils, trades and planners to examine sites and their historical changes without conducting site visits.
Australia's national aerial photography archive extends considerably further into the past. Geoscience Australia's collection contains "over 1.2 million aerial photos, some dating back as far as 1928". These historical records provide valuable evidence of changes in land conditions and use over time.
The National Library of Australia also maintains a collection of Australian aerial photographs captured between 1928 and 1987. State governments maintain separate archives, including Victoria's land agency, which provides public sector access to imagery ranging from historical photographs dating to the 1930s through to recent high-resolution captures.
The MetroMap archive incorporates some of these historical imagery layers within the platform, including photographs of Sydney dating as far back as 1943.
Different professional teams use MetroMap imagery for a range of applications:
The MetroMap Swipe tool displays imagery from two capture dates side by side, making changes over time easier to identify, including newly constructed sheds, cleared land parcels and tree loss.
MetroMap offers this imagery through an annual subscription to MetroMap 2D aerial imagery. The MetroMap Pro plan costs $2,640 per year, including GST, for one named user, based on annual payment. The Team plan costs $6,999 per year, including GST, for up to five named users, based on annual payment. Enterprise plans are also available, with pricing provided upon request from MetroMap. MetroMap is 100% Australian operated.
The future of aerial photography lies in software that analyses imagery beyond conventional visual inspection, a capability already demonstrated by MetroMap Insights. The platform identifies and extracts six features from MetroMap imagery: buildings, pools, solar panels, trees, driveways and grass.
MetroMap Insights can identify swimming pools across a suburb, while its solar feature generates a CSV file containing addresses and other details of solar installations. Businesses can use these datasets to identify prospective customers for services such as cleaning and fencing.
Aerial photos are taken from planes or drones, far below a satellite. Free satellite data from Landsat and Sentinel-2 has a GSD of 10 to 60 m, while MetroMap’s aerial imagery is 7 to 10 cm GSD per pixel. Satellite data suits broad views, and aerial photos suit closer inspection and accurate measurement of roofs, lots and driveways.
A drone suits one site that needs a fresh capture, within CASA's 120 m height limit and the pilot's sight. A plane suits a whole city or region flown on a schedule, which is how MetroMap covers capital cities on a rolling plan through the year.
Update rates depend on the area and the provider. MetroMap captures capital cities up to 6 times a year and regional areas about once a year, and shows the capture date on each image layer.
Geoscience Australia holds over 1.2 million aerial photos, some from as far back as 1928. MetroMap holds 25 years or more of its own imagery in some areas.
MetroMap imagery is captured from above at 7 to 10 cm per pixel, which is not clear enough to identify a person, so MetroMap does not blur its imagery. MetroMap does not capture street-level photos for its aerial program, and Street View in MapViewer is supplied by Google.
A colour infrared image uses near-infrared light, which the eye can't see, and shows healthy plants in bright red. Near infrared is useful for vegetation health analysis and for certain water-body detections such as swimming pools, and some MetroMap imagery includes this fourth band.
View the world from our eyes ! Here we share some exciting images from across MetroMap