Our tree canopy measurement service builds on years of experience and refinement, testing the three most common measurement methods: aerial imagery, LIDAR, and I-Tree Canopy. We have found strengths and limitations for the end-user to consider before choosing which is best for their needs.
Tree canopies and the urban forest are highly impactful climate change mitigation assets. A tree’s thermal and shading benefits reduce air and ground temperatures, making urban areas safer and more livable. As urban development accelerates, so does the clearing of trees, and their replacement with built infrastructure creates urban heat islands. The result is increasingly hot urban areas exacerbated by broader temperature increases associated with ongoing climate change.
The challenge for local councils and shires wanting to mitigate urban heat is to make meaningful tree canopy and urban forest policies, and accurately measure their effectiveness over time. Choosing the most suitable base data will inform better, more communicable policies and help councils measure success over time.
Here we offer an explainer and evaluation of the three most common ways to measure tree canopies and the best use for each data type.
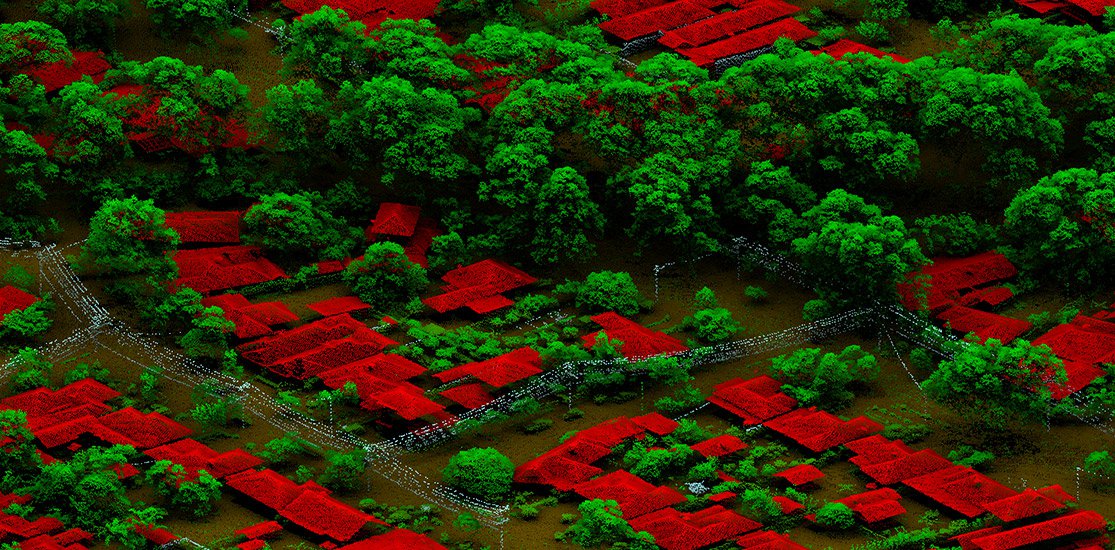
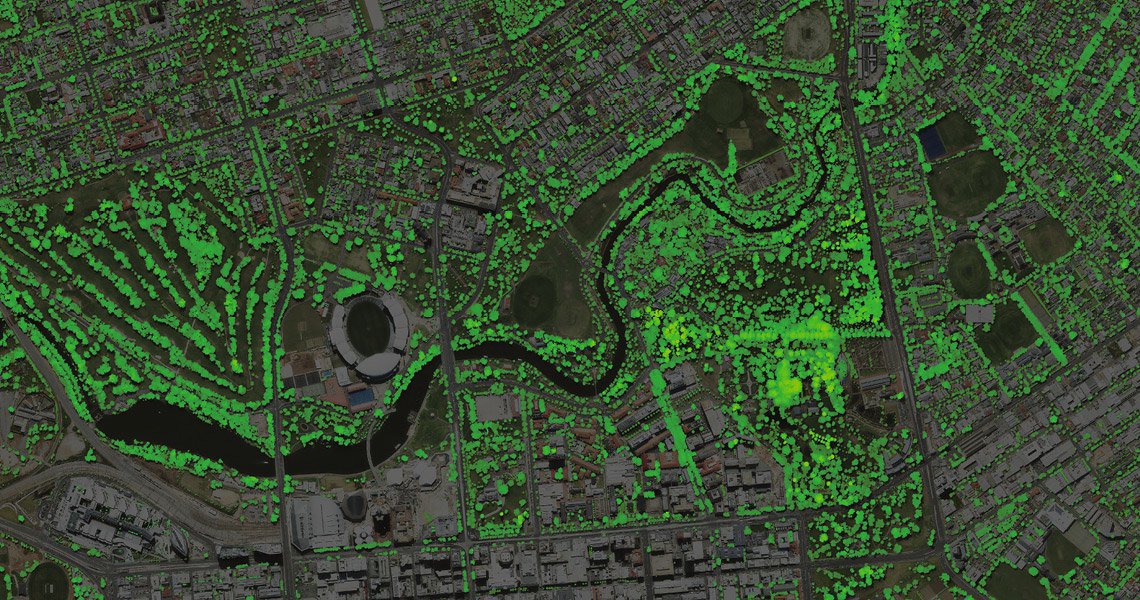
Simply put, LiDAR (Light Detection and Ranging) is the most repeatable & accurate way to measure 3D space at any scale, and as such, is the most precise way to measure tree canopies and gauge changes over time. LiDAR measures the time taken by a laser pulse emitted from an aeroplane-mounted sensor to travel to and reflect off the earth’s surface back to the sensor.
Each reflection becomes a measurement point, and the millions of individual points become a LIDAR point cloud that accurately measures the urban landscape in three dimensions.
LiDAR explicitly measures a tree’s location in a three-dimensional structure and is accurate enough to measure canopy change at individual tree levels, allowing councils to segment LiDAR data to track tree canopy within specific areas and better understand changing distribution and land ownership status.
LiDAR data is flexible, with applications well beyond tree canopy measurement alone. Investing in a high-resolution LiDAR dataset benefits all spatial data users and provides ongoing benefits beyond tree canopy projects.
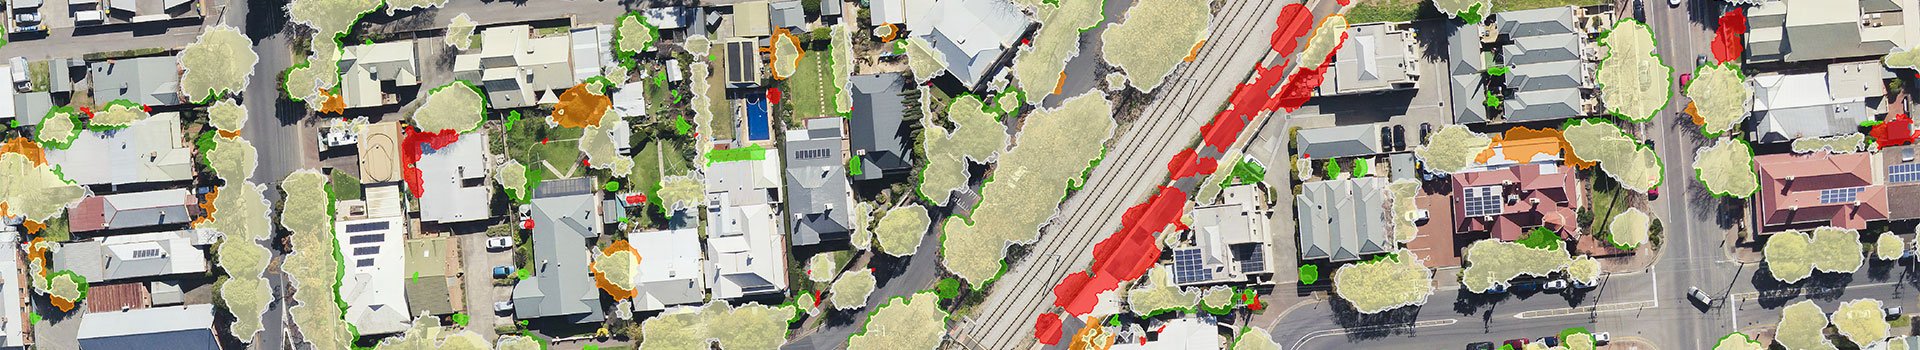
High-resolution aerial imagery with artificial intelligence-based tree canopy coverage measurement is cost-effective and representative across large areas, making it suitable for macro insights. There are, however, inherent limitations when trying to develop policies using aerial imagery alone.
Trained AI systems recognise trees within aerial imagery and calculate their area. AI and aerial imagery measurement works well at large-scale but is less accurate at smaller, property-scale sizes. Aspect distortions with aerial imagery mean trees will be measured on an angle or obscured by buildings; in large areas, aspect-lean averages out, but it’s more extreme at small scales. A small area has potentially high variance from real-world canopy coverage, and each subsequent set of aerial imagery will vary from the previous.
Aerial imagery only gives a two-dimensional view and will not account for canopy height, as LiDAR does. All tree canopy coverage will be weighted equally in aerial imagery calculations, regardless of whether a tree gives on-ground thermal benefits. Aerial imagery will not measure vertical growth either.
Policy written from AI and aerial imagery-derived data must focus on large areas and offset the inherent variability at a small scale. It is effective for measuring large areas, making it suitable for tree canopy coverage overview.
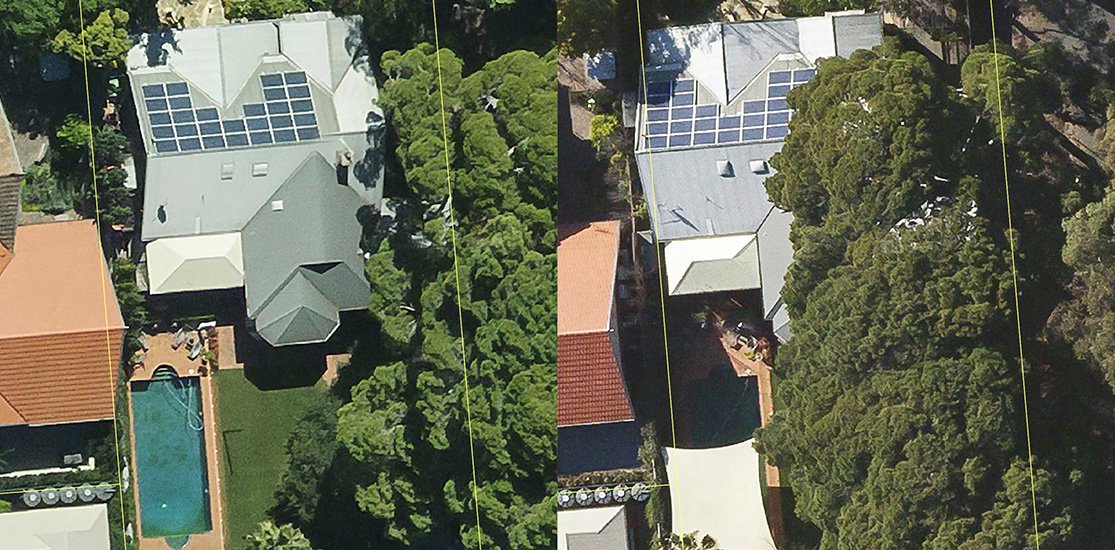
The same property with varying aspect lean can give significantly different canopy coverage measurements within the same cadastral boundaries.
i-Tree Canopy is a free web-based measurement platform using statistical algorithms applied to Google Earth imagery. It’s popular and open for anyone to use with a simple set of drawing tools and data outputs.
i-Tree Canopy’s simple and accessible web interface contributes significantly to increased awareness of protecting the urban forest. It has empowered environmental management experts to track tree canopy cover that otherwise may not access more complex methodologies. i-Tree Canopy’s best use case is making broad and generalised insights across large areas.
However, i-Tree Canopy’s weakness is accuracy. It uses free, low-resolution Google Earth satellite imagery and the derived data is less accurate than LiDAR and aerial imagery. i-Tree Canopy is, therefore, the least suitable measurement on which to base policy decisions and measure policy effectiveness.
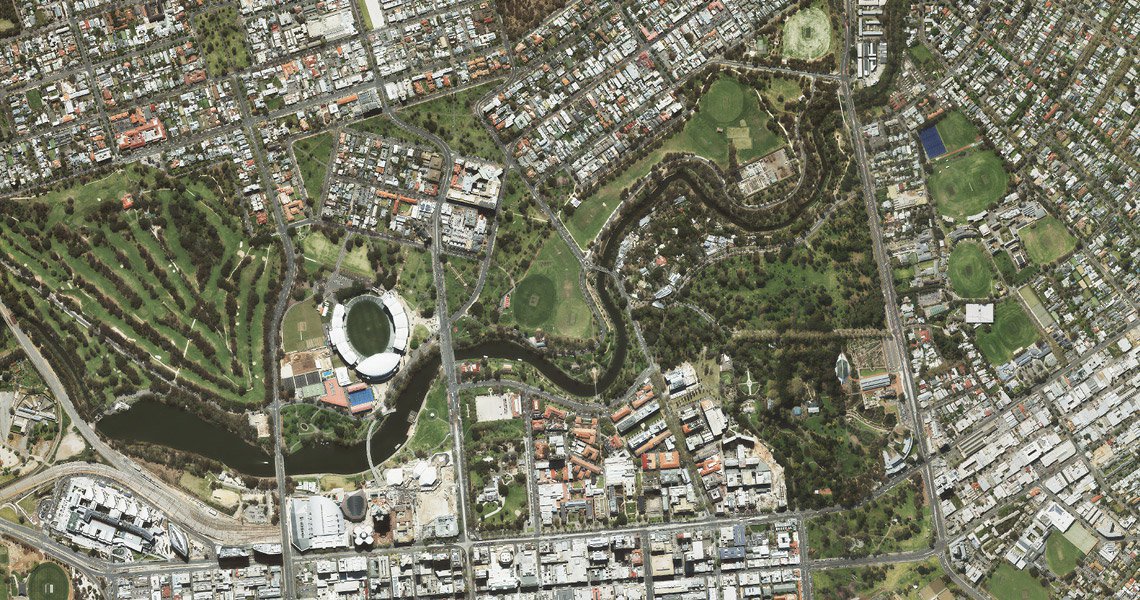
LiDAR combined with aerial imagery provides the best overall dataset for councils and government bodies to accurately quantify and track changes in tree canopy coverage.
We determined that a mixture of LiDAR and aerial imagery provides the best overall dataset for councils and government bodies to accurately quantify and track changes in tree canopy coverage, write more effective policies, and measure the efficacy of those policies.
The City of Unley in South Australia commissioned us to measure, quantify, and track changes in tree canopies across their jurisdiction. The base datasets were LiDAR captures in 2018 and 2021, with supplementary high-resolution MetroMap aerial imagery data segmenting the canopy change into existing tree growth, pruning existing trees, tree removal, and tree planting.
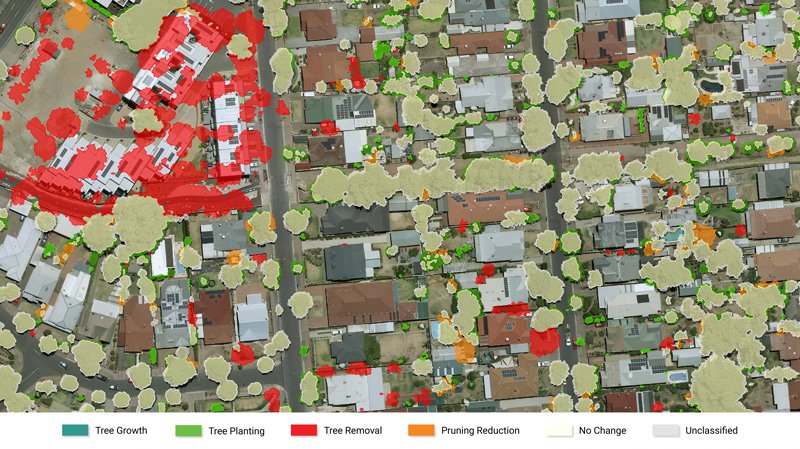
The quality base data gave valuable and precise insights for the City of Unley, such as:
The City of Unley’s dataset shows precisely how much and where tree canopy coverage changed, with added land ownership data indicating who is responsible for that change. It’s a robust, communicable dataset for all their needs.